Evidence Based Medicine
Statistics
Box and whisker plots are typically used to display:
Answer:
Box plots or box and whisker plots are used to display the median and interquartile range.Interquartile Range
Evidence Based Medicine / Statistics
Last Updated: 29th July 2024
It is useful to have some measure of the variation of observations about the mean or median. Measures of variation differ whether the data is normally distributed or non-normally distributed:
- In a normally distributed data set, the mean and standard deviation are used to describe variation.
- In a non-normally distributed data set, the median and interquartile range are used to describe variation.
Range
The range states the difference between the largest and smallest values in the data set and can be given as two numbers or a single value.
The range however does not give much indication of the average spread of observations about the mean and provides a misleading measure of spread if there are outliers.
Interquartile Range
A more robust approach is to determine the interquartile range, which is largely unaffected by sample size, and usually unaffected by outliers.
The interquartile range (IQ) is a measure of spread given by the difference between the first quartile (the value below which 25% of the observations lie) and the third quartile (the value below which 75% of the observations lie). It focuses on the spread of the middle 50% of the values in an ordered data set.
Box and Whisker Plot
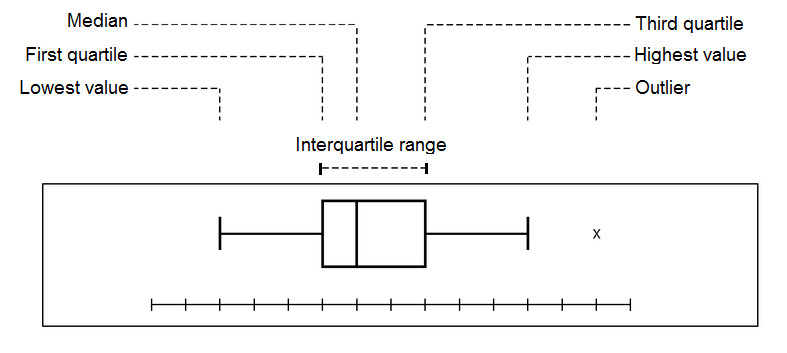
A boxplot is a vertical or horizontal rectangle used to display the interquartile range, with the ends of the rectangle corresponding to the upper and lower quartiles of the data values. The box contains 50% of the data values. A line drawn through the rectangle corresponds to the median value. Whiskers, starting at the ends of the rectangle usually indicate the minimum and maximum values, therefore the entire box and whisker plot represents the range. Any outliers can be plotted independent of the box and whisker plot.

Box and Whisker Plot. (Image modified by FRCEM Success. Original by Madyno (Own work) [CC BY-SA 3.0 , via Wikimedia Commons)
Report A Problem
Is there something wrong with this question? Let us know and we’ll fix it as soon as possible.
Loading Form...
- Biochemistry
- Blood Gases
- Haematology
| Biochemistry | Normal Value |
|---|---|
| Sodium | 135 – 145 mmol/l |
| Potassium | 3.0 – 4.5 mmol/l |
| Urea | 2.5 – 7.5 mmol/l |
| Glucose | 3.5 – 5.0 mmol/l |
| Creatinine | 35 – 135 μmol/l |
| Alanine Aminotransferase (ALT) | 5 – 35 U/l |
| Gamma-glutamyl Transferase (GGT) | < 65 U/l |
| Alkaline Phosphatase (ALP) | 30 – 135 U/l |
| Aspartate Aminotransferase (AST) | < 40 U/l |
| Total Protein | 60 – 80 g/l |
| Albumin | 35 – 50 g/l |
| Globulin | 2.4 – 3.5 g/dl |
| Amylase | < 70 U/l |
| Total Bilirubin | 3 – 17 μmol/l |
| Calcium | 2.1 – 2.5 mmol/l |
| Chloride | 95 – 105 mmol/l |
| Phosphate | 0.8 – 1.4 mmol/l |
| Haematology | Normal Value |
|---|---|
| Haemoglobin | 11.5 – 16.6 g/dl |
| White Blood Cells | 4.0 – 11.0 x 10⁹/l |
| Platelets | 150 – 450 x 109/l |
| MCV | 80 – 96 fl |
| MCHC | 32 – 36 g/dl |
| Neutrophils | 2.0 – 7.5 x 10⁹/l |
| Lymphocytes | 1.5 – 4.0 x 10⁹/l |
| Monocytes | 0.3 – 1.0 x 10⁹/l |
| Eosinophils | 0.1 – 0.5 x 10⁹/l |
| Basophils | < 0.2 x 10⁹/l |
| Reticulocytes | < 2% |
| Haematocrit | 0.35 – 0.49 |
| Red Cell Distribution Width | 11 – 15% |
| Blood Gases | Normal Value |
|---|---|
| pH | 7.35 – 7.45 |
| pO2 | 11 – 14 kPa |
| pCO2 | 4.5 – 6.0 kPa |
| Base Excess | -2 – +2 mmol/l |
| Bicarbonate | 24 – 30 mmol/l |
| Lactate | < 2 mmol/l |

