

Evidence Based Medicine
Statistics
Regarding relationships between two variables, what does a negative correlation coefficient of -1 indicate:
Answer:
A negative correlation coefficient means that the two variables are inversely proportional e.g. socio-economic class and mortality.Correlation
Evidence Based Medicine / Statistics
Last Updated: 29th July 2024
When there is a linear relationship between two variables, there is said to be correlation.
Correlation Tests
Correlation tests are used to evaluate the strength of a linear relationship between two variables measured in a single group, without making any implication about cause and effect in that relationship.
The Pearson's correlation coefficient can be used if the values are sampled from normal populations, otherwise the non-parametric equivalent, the Spearman's rank correlation coefficient, can be used.
If it is believed that the relationship between a dependent and an independent variable is nonlinear, it might be necessary to transform the data using logarithms or square roots.
Correlation Coefficient
The strength of a relationship is given by the correlation coefficient (r), which can be between -1.0 and +1.0.
A positive correlation coefficient means that as the value of one variable increases, the value of the other variable increases e.g. height and weight in healthy growing children.
A negative correlation coefficient means that as the value of one variable increases, the value of the other variable decreases e.g. socio-economic class and mortality.
If there is a perfect relationship between the two variables, then r = 1 (+ or -). The closer that r is to 1, the greater the strength of correlation (and the closer the points are to a straight line).
If there is no correlation between two variables, then r = 0. The closer that r is to 0, the weaker the correlation.
Generally:
- r = 0 - 0.2: very low correlation (probably meaningless)
- r = 0.2 - 0.4: low correlation (might warrant further investigation)
- r = 0.4 - 0.6: reasonable correlation
- r = 0.6 - 0.8: high correlation
- r = 0.8 - 1.0: very high correlation (check for errors or other reasons for such high correlation)
The square of the correlation coefficient (r2 )is the coefficient of determination, an estimate of the percentage variation in one variable that is explained by the other variable. This is useful when interpreting clinical relevance.
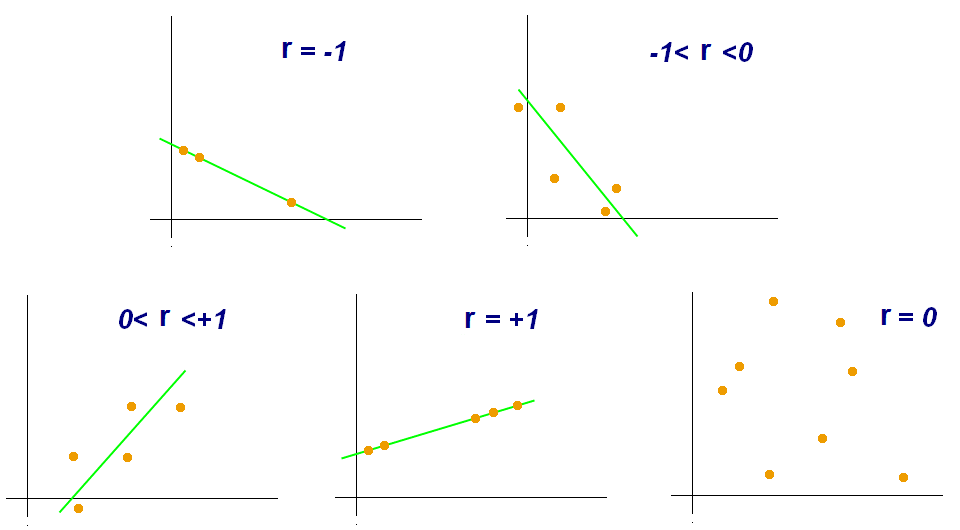
Correlation Coefficients. (Image by Kiatdd (Own work) [CC BY-SA 3.0 , via Wikimedia Commons)
Report A Problem
Is there something wrong with this question? Let us know and we’ll fix it as soon as possible.
Loading Form...
- Biochemistry
- Blood Gases
- Haematology
| Biochemistry | Normal Value |
|---|---|
| Sodium | 135 – 145 mmol/l |
| Potassium | 3.0 – 4.5 mmol/l |
| Urea | 2.5 – 7.5 mmol/l |
| Glucose | 3.5 – 5.0 mmol/l |
| Creatinine | 35 – 135 μmol/l |
| Alanine Aminotransferase (ALT) | 5 – 35 U/l |
| Gamma-glutamyl Transferase (GGT) | < 65 U/l |
| Alkaline Phosphatase (ALP) | 30 – 135 U/l |
| Aspartate Aminotransferase (AST) | < 40 U/l |
| Total Protein | 60 – 80 g/l |
| Albumin | 35 – 50 g/l |
| Globulin | 2.4 – 3.5 g/dl |
| Amylase | < 70 U/l |
| Total Bilirubin | 3 – 17 μmol/l |
| Calcium | 2.1 – 2.5 mmol/l |
| Chloride | 95 – 105 mmol/l |
| Phosphate | 0.8 – 1.4 mmol/l |
| Haematology | Normal Value |
|---|---|
| Haemoglobin | 11.5 – 16.6 g/dl |
| White Blood Cells | 4.0 – 11.0 x 10⁹/l |
| Platelets | 150 – 450 x 109/l |
| MCV | 80 – 96 fl |
| MCHC | 32 – 36 g/dl |
| Neutrophils | 2.0 – 7.5 x 10⁹/l |
| Lymphocytes | 1.5 – 4.0 x 10⁹/l |
| Monocytes | 0.3 – 1.0 x 10⁹/l |
| Eosinophils | 0.1 – 0.5 x 10⁹/l |
| Basophils | < 0.2 x 10⁹/l |
| Reticulocytes | < 2% |
| Haematocrit | 0.35 – 0.49 |
| Red Cell Distribution Width | 11 – 15% |
| Blood Gases | Normal Value |
|---|---|
| pH | 7.35 – 7.45 |
| pO2 | 11 – 14 kPa |
| pCO2 | 4.5 – 6.0 kPa |
| Base Excess | -2 – +2 mmol/l |
| Bicarbonate | 24 – 30 mmol/l |
| Lactate | < 2 mmol/l |