Evidence Based Medicine
Statistics
A range of one standard deviation above and below the mean includes what approximate percentage of the sample values:
Answer:
A range of one SD above and below the mean (+/- 1 SD) includes 68.2% of the sample values.Standard Deviation
Evidence Based Medicine / Statistics
Last Updated: 26th July 2024
It is useful to have some measure of the variation of observations about the mean or median. Measures of variation differ whether the data is normally distributed or non-normally distributed:
- In a normally distributed data set, the mean and standard deviation are used to describe variation.
- In a non-normally distributed data set, the median and interquartile range are used to describe variation.
Normal (Gaussian) Distribution
The normal distribution is:
- bell-shaped (unimodal)
- symmetrical about its mean (and the mean and median are equal)
- completely described by two parameters, the mean and the standard deviation of the population
- shifted to the right if the mean is increased and to the left if the mean is decreased (for a constant standard deviation)
- flattened as the standard deviation is increased but becomes more peaked as the standard deviation is decreased (for a fixed mean)
Standard Deviation
The variance indicates the dispersion of the values around the mean. The variance is equal to the average distance by which each individual observation differs from the mean value.
The standard deviation is the square root of the variance and provides a measure of the spread of sample values around the sample mean. It is calculated by taking the square root of the average squared difference between each value and the mean and is approximately equivalent to the average difference between the sample value and the mean. A data set with a larger standard deviation has a wider spread of data and vice versa.
Standard deviation (SD, σ) is used for describing the variability of normally-distributed data, for non-normally distributed data, the interquartile range is a better measure.
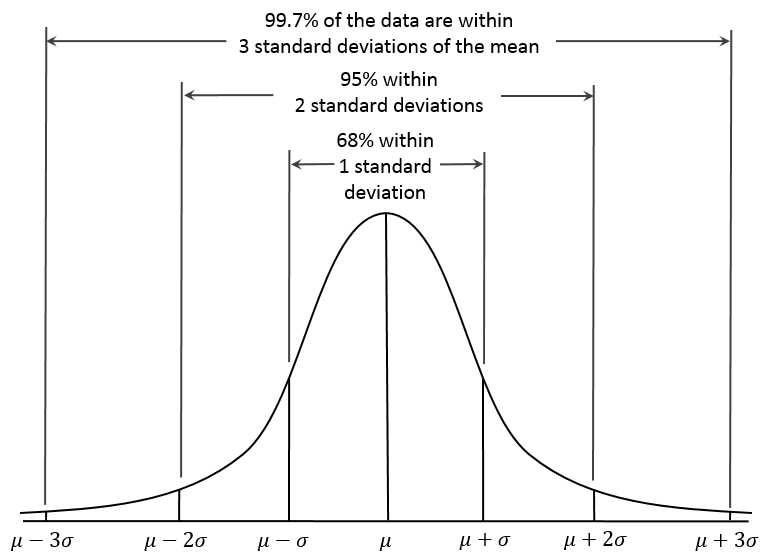
If we know the mean and standard deviation of a set of normally distributed observations, we can estimate the range of values that would be expected to include certain proportions of observations:
- A range of one SD above and below the mean (+/- 1 SD) includes 68.2% of the sample values
- +/- 2 SD includes 95.4% of the values
- +/- 3 SD includes 99.7% of the values

Standard Deviation about the Mean. (Image by Dan Kernler (Own work) [CC BY-SA 4.0 , via Wikimedia Commons)
Report A Problem
Is there something wrong with this question? Let us know and we’ll fix it as soon as possible.
Loading Form...
- Biochemistry
- Blood Gases
- Haematology
| Biochemistry | Normal Value |
|---|---|
| Sodium | 135 – 145 mmol/l |
| Potassium | 3.0 – 4.5 mmol/l |
| Urea | 2.5 – 7.5 mmol/l |
| Glucose | 3.5 – 5.0 mmol/l |
| Creatinine | 35 – 135 μmol/l |
| Alanine Aminotransferase (ALT) | 5 – 35 U/l |
| Gamma-glutamyl Transferase (GGT) | < 65 U/l |
| Alkaline Phosphatase (ALP) | 30 – 135 U/l |
| Aspartate Aminotransferase (AST) | < 40 U/l |
| Total Protein | 60 – 80 g/l |
| Albumin | 35 – 50 g/l |
| Globulin | 2.4 – 3.5 g/dl |
| Amylase | < 70 U/l |
| Total Bilirubin | 3 – 17 μmol/l |
| Calcium | 2.1 – 2.5 mmol/l |
| Chloride | 95 – 105 mmol/l |
| Phosphate | 0.8 – 1.4 mmol/l |
| Haematology | Normal Value |
|---|---|
| Haemoglobin | 11.5 – 16.6 g/dl |
| White Blood Cells | 4.0 – 11.0 x 10⁹/l |
| Platelets | 150 – 450 x 109/l |
| MCV | 80 – 96 fl |
| MCHC | 32 – 36 g/dl |
| Neutrophils | 2.0 – 7.5 x 10⁹/l |
| Lymphocytes | 1.5 – 4.0 x 10⁹/l |
| Monocytes | 0.3 – 1.0 x 10⁹/l |
| Eosinophils | 0.1 – 0.5 x 10⁹/l |
| Basophils | < 0.2 x 10⁹/l |
| Reticulocytes | < 2% |
| Haematocrit | 0.35 – 0.49 |
| Red Cell Distribution Width | 11 – 15% |
| Blood Gases | Normal Value |
|---|---|
| pH | 7.35 – 7.45 |
| pO2 | 11 – 14 kPa |
| pCO2 | 4.5 – 6.0 kPa |
| Base Excess | -2 – +2 mmol/l |
| Bicarbonate | 24 – 30 mmol/l |
| Lactate | < 2 mmol/l |

