Evidence Based Medicine
Statistics
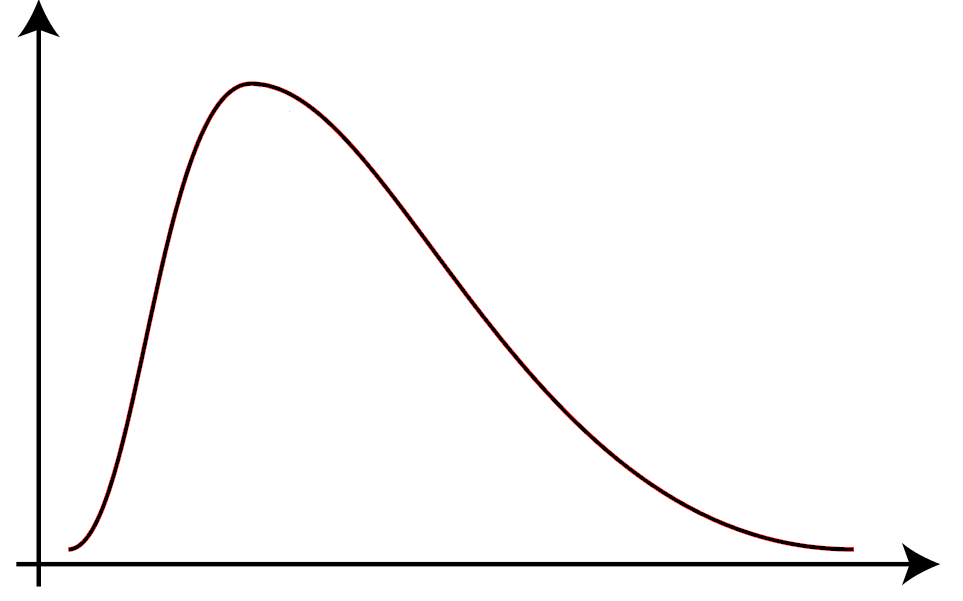
Regarding the following data distribution, which of the following statements is CORRECT:

(Image modified by FRCEM Success. Original by Rodolfo Hermans (Godot) at en.wikipedia. [CC BY-SA 3.0 , via Wikimedia Commons)
Answer:
This unimodal distribution is positively skewed. In a positive skew, the right tail is longer and the mass of distribution is concentrated on the left. The mean > median > mode.Data Distributions
Evidence Based Medicine / Statistics
Last Updated: 29th July 2024
The choice of the most appropriate statistical method will depend on the shape of the distribution of data.
Distribution of data is usually unimodal (one peak) but may be bimodal (two peaks) or uniform (no peaks, each value equally likely).
![By NIST [Public domain], via Wikimedia Commons](https://primary-cdn.frcemsuccess.com/wp-content/uploads/2017/03/Normal-distribution.gif)
Unimodal Distribution. (Image by NIST [Public domain], via Wikimedia Commons)
![By Tungsten (Own work) [Public domain], via Wikimedia Commons](https://mrcemsuccess.com/wp-content/uploads/2017/03/Bimodal-distribution.png)
Bimodal Distribution. (Image by Tungsten (Own work) [Public domain], via Wikimedia Commons)
Skewed Distribution
When the distribution is unimodal, the main aim is to see where the majority of the data values lie, relative to the maximum and minimum values.
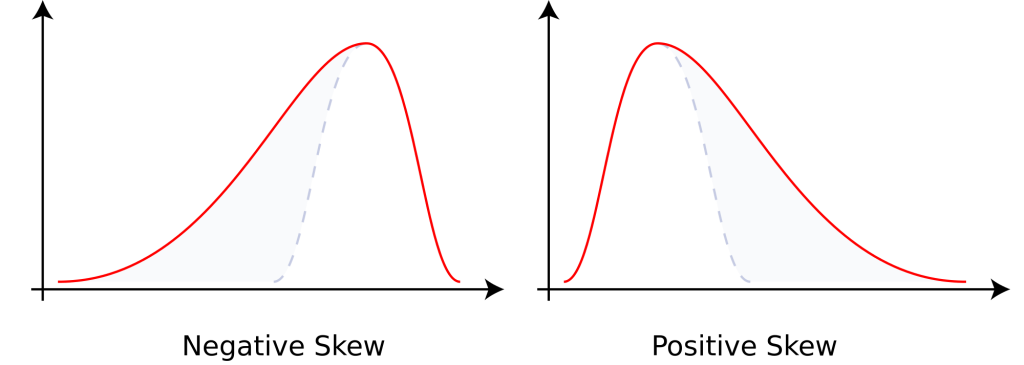
A unimodal distribution may be symmetrical, positively skewed (skewed to the right) or negatively skewed (skewed to the left):
- A symmetrical distribution is centred around a midpoint, with each side being a mirror-image of the other; mean = median = mode.
- In a positive skew, the right tail is longer and the mass of distribution is concentrated on the left; mean > median > mode.
- In a negative skew, the left tail is longer and the mass of distribution is concentrated on the right; mean < median < mode.

Skewed Distributions. (Image by Rodolfo Hermans (Godot) at en.wikipedia. [CC BY-SA 3.0 , via Wikimedia Commons)
Normal (Gaussian) Distribution
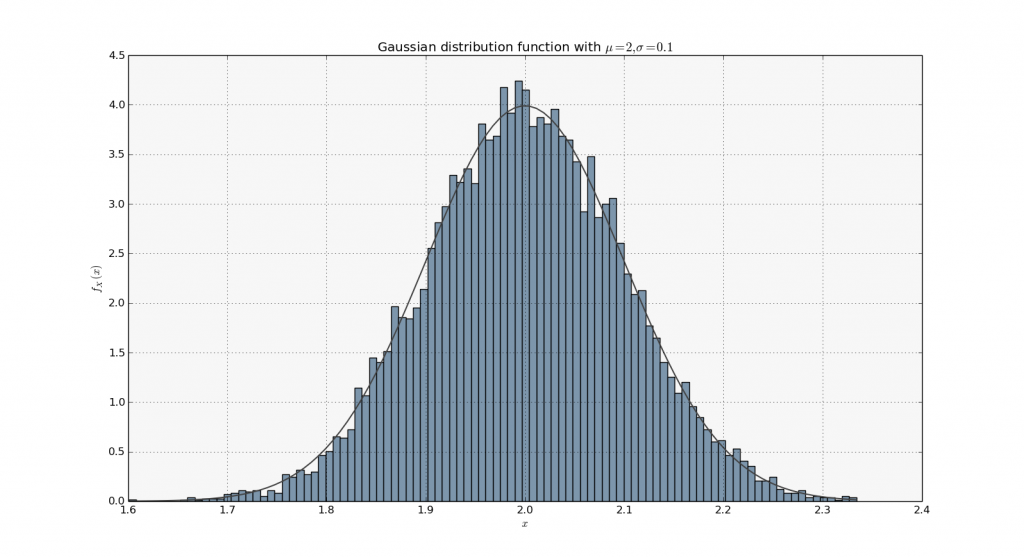
Many continuous variables, such as height, have a normal distribution in the population.
The normal distribution is:
- bell-shaped (unimodal)
- symmetrical about its mean (and the mean and median are equal)
- completely described by two parameters, the mean and the standard deviation of the population
- shifted to the right if the mean is increased and to the left if the mean is decreased (for a constant standard deviation)
- flattened as the standard deviation is increased but becomes more peaked as the standard deviation is decreased (for a fixed mean)
Continuous variables in a normal distribution are evaluated using parametric methods. (Continuous variables that are not normally distributed or for which no assumptions about distribution can be made are evaluated using non-parametric methods.)
If a distribution appears to be positively or negatively skewed it can often be transferred to a normal distribution by taking the logarithm, reciprocal or square root of each observation.

Normal Distribution. (Image by Shishirdasika (Own work) [CC BY-SA 3.0 , via Wikimedia Commons)
Binomial Distribution
Categorical data have a binomial (or if more than two categories, multinomial) distribution. The probability of the number of successes in a sequence of individual observations (e.g. heads vs. tails in a series of coin tosses) is plotted against the sample size. If the sample size is large enough, the shape will look similar to a normal distribution.
Poisson Distribution
Categorical data about the number of some discrete event occurring over a specified time e.g. number of seizures per year follow the Poisson distribution. This distribution usually arises in the context of an event with a low probability in a very large population, and in which there is no theoretical limit to the number of events that could occur.
Report A Problem
Is there something wrong with this question? Let us know and we’ll fix it as soon as possible.
Loading Form...
- Biochemistry
- Blood Gases
- Haematology
| Biochemistry | Normal Value |
|---|---|
| Sodium | 135 – 145 mmol/l |
| Potassium | 3.0 – 4.5 mmol/l |
| Urea | 2.5 – 7.5 mmol/l |
| Glucose | 3.5 – 5.0 mmol/l |
| Creatinine | 35 – 135 μmol/l |
| Alanine Aminotransferase (ALT) | 5 – 35 U/l |
| Gamma-glutamyl Transferase (GGT) | < 65 U/l |
| Alkaline Phosphatase (ALP) | 30 – 135 U/l |
| Aspartate Aminotransferase (AST) | < 40 U/l |
| Total Protein | 60 – 80 g/l |
| Albumin | 35 – 50 g/l |
| Globulin | 2.4 – 3.5 g/dl |
| Amylase | < 70 U/l |
| Total Bilirubin | 3 – 17 μmol/l |
| Calcium | 2.1 – 2.5 mmol/l |
| Chloride | 95 – 105 mmol/l |
| Phosphate | 0.8 – 1.4 mmol/l |
| Haematology | Normal Value |
|---|---|
| Haemoglobin | 11.5 – 16.6 g/dl |
| White Blood Cells | 4.0 – 11.0 x 10⁹/l |
| Platelets | 150 – 450 x 109/l |
| MCV | 80 – 96 fl |
| MCHC | 32 – 36 g/dl |
| Neutrophils | 2.0 – 7.5 x 10⁹/l |
| Lymphocytes | 1.5 – 4.0 x 10⁹/l |
| Monocytes | 0.3 – 1.0 x 10⁹/l |
| Eosinophils | 0.1 – 0.5 x 10⁹/l |
| Basophils | < 0.2 x 10⁹/l |
| Reticulocytes | < 2% |
| Haematocrit | 0.35 – 0.49 |
| Red Cell Distribution Width | 11 – 15% |
| Blood Gases | Normal Value |
|---|---|
| pH | 7.35 – 7.45 |
| pO2 | 11 – 14 kPa |
| pCO2 | 4.5 – 6.0 kPa |
| Base Excess | -2 – +2 mmol/l |
| Bicarbonate | 24 – 30 mmol/l |
| Lactate | < 2 mmol/l |

