

Physiology
Cardiovascular
All of the following cause a rightward shift along the Starling curve, EXCEPT for:
Answer:
The volume of blood in the ventricle at the start of systole, the end-diastolic volume (EDV), depends on the end-diastolic pressure (EDP) and the compliance of the ventricular wall. Right ventricular EDP is dependent on right atrial and hence central venous pressure (CVP). If EDP (and thus EDV) is increased, the force of the following contraction, and thus stroke volume increases; this is known as the Frank-Starling relationship. This represents a rightward shift along the Starling function curve. Ventricular filling and therefore preload is increased by:- Increased central venous pressure which can result from:
- Decreased venous compliance caused by venoconstriction
- Increased thoracic blood volume caused by either an increase in total blood volume or an increase in venous return (augmented by increased respiratory activity, increased skeletal muscle pump activity or by gravity in head-down tilt).
- Increased ventricular compliance
- Increased atrial activity caused by sympathetic stimulation or from increased filling of the atria
- Reduced heart rate (which increases ventricular filling time)
Frank-Starling Relationship
Physiology / Cardiovascular / Cardiac Output
Last Updated: 18th April 2020
Cardiac output is determined by the heart rate and stroke volume. Stroke volume is dependent on the filling pressure (the preload), the cardiac muscle force (the contractility) and the pressure against which the heart has to pump (the afterload).
Frank-Starling Relationship
The volume of blood in the ventricle at the start of systole, the end-diastolic volume (EDV), depends on the end-diastolic pressure (EDP) and the compliance of the ventricular wall. Right ventricular EDP is dependent on right atrial and hence central venous pressure (CVP). If EDP (and thus EDV) is increased, the force of the following contraction, and thus stroke volume increases; this is known as the Frank-Starling relationship.
Starling's law of the heart states that 'the energy released during contraction depends on the initial fibre length'. An increase in EDV causes an increase in ventricular fibre length, which produces an increase in developed tension and results in an increased force of systolic contraction. As muscle is stretched, more myosin cross-bridges can form, increasing force. However, cardiac muscle has a much steeper relationship between stretch and force than skeletal muscle, because in the heart stretch also increases the Ca2+ sensitivity of troponin, so more force is generated for the same intracellular Ca2+.
The most important consequence of Starling's law is that output is matched between the right and left ventricles. It thus explains how CVP, although only perceived by the right ventricle, also influences left ventricular function and cardiac output, and why postural hypotension and haemorrhage reduce cardiac output. It also allows the heart to sustain output when afterload is increased, or contractility is reduced, as both lead to accumulation of venous blood and a raised EDP, which increases ventricular force and restores stroke volume.
Factors affecting the Frank-Starling Curve
The Frank-Starling curve is affected by:
- Preload
- Increases in preload cause a rightward shift along the curve
- Decreases in preload cause a leftward shift along the curve
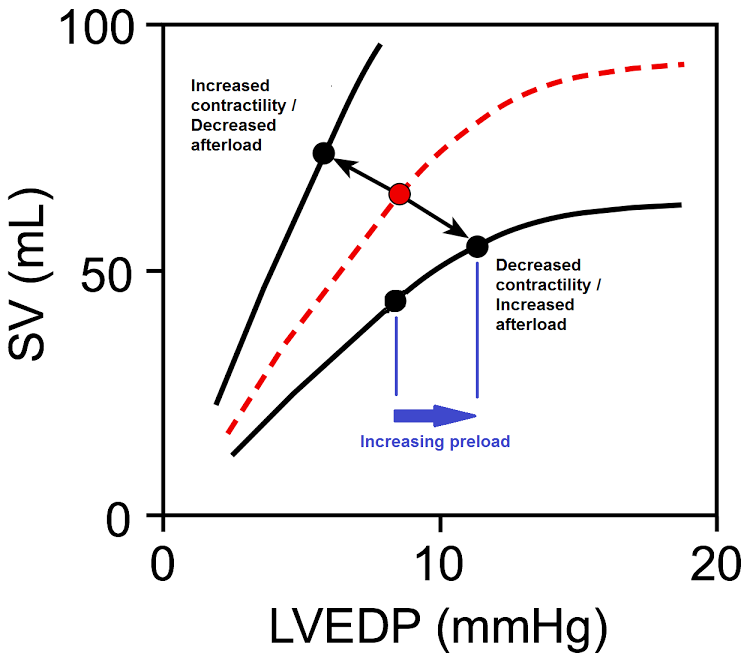
- Contractility
- Increases in contractility shift the curve upwards and to the left
- Decreases in contractility shift the curve downwards and to the right
- Afterload
- Increases in afterload shift the curve downwards and to the right
- Decreases in afterload shift the curve upwards and to the left
Frank-Starling Curve. (Image by OpenStax College [Public domain], via Wikimedia Commons)
Preload
Preload can be defined as the initial stretching of the cardiac myocytes prior to contraction. Preload, therefore, is related to muscle sarcomere length. Because sarcomere length cannot be determined in the intact heart, other indices of preload are used such as ventricular end-diastolic volume or pressure. When venous return to the heart is increased, the end-diastolic pressure and volume of the ventricles are increased, which stretches the sarcomeres, thereby increasing their preload.
Ventricular filling and therefore preload is increased by:
- Increased central venous pressure which can result from:
- Decreased venous compliance caused by venoconstriction
- Increased thoracic blood volume caused by either an increase in total blood volume or an increase in venous return (augmented by increased respiratory activity, increased skeletal muscle pump activity or by gravity in head-down tilt).
- Increased ventricular compliance
- Increased atrial activity caused by sympathetic stimulation or from increased filling of the atria
- Reduced heart rate (which increases ventricular filling time)
Ventricular filling and therefore preload is decreased by:
- Decreased central venous pressure caused by:
- Reduced blood volume e.g. haemorrhage
- Gravity causing blood to pool in lower limbs when standing
- Impaired atrial activity e.g. in atrial fibrillation
- Tachycardia which reduces ventricular filling time
- Decreased ventricular compliance e.g. ventricular hypertrophy
- Inflow (mitral and tricuspid) valve stenosis which reduces ventricular filling
Contractility
Contractility (inotropy) is the intrinsic ability of cardiac muscle to develop force at a given muscle length. It is determined by the intracellular [Ca2+] and can be estimated by the ejection fraction. Increases in contractility cause an increase in stroke volume/cardiac output for any level of right atrial pressure or end-diastolic volume, and hence shift the Starling curve upwards. Decreases in contractility cause a decrease in stroke volume/cardiac output for any level of right atrial pressure or end-diastolic volume and hence shift the Starling curve downwards.
Afterload
Afterload is determined by the resistance to outflow from the ventricle, which for the left ventricle is mainly determined by the aortic pressure, and for the right, the pulmonary artery pressure.
An increase in afterload (e.g. hypertension, valve stenosis) means that the ventricles must eject blood against a higher pressure, resulting in a decrease in stroke volume and a downward shift of the Starling curve.
This decrease in stroke volume however results in an increase in end-systolic volume. As a result, blood accumulates on the venous side and filling pressure rises. This will result in a secondary increase in preload and a rightward shift along the Starling curve; cardiac output is restored at the expense of an increased EDP.
Report A Problem
Is there something wrong with this question? Let us know and we’ll fix it as soon as possible.
Loading Form...
- Biochemistry
- Blood Gases
- Haematology
| Biochemistry | Normal Value |
|---|---|
| Sodium | 135 – 145 mmol/l |
| Potassium | 3.0 – 4.5 mmol/l |
| Urea | 2.5 – 7.5 mmol/l |
| Glucose | 3.5 – 5.0 mmol/l |
| Creatinine | 35 – 135 μmol/l |
| Alanine Aminotransferase (ALT) | 5 – 35 U/l |
| Gamma-glutamyl Transferase (GGT) | < 65 U/l |
| Alkaline Phosphatase (ALP) | 30 – 135 U/l |
| Aspartate Aminotransferase (AST) | < 40 U/l |
| Total Protein | 60 – 80 g/l |
| Albumin | 35 – 50 g/l |
| Globulin | 2.4 – 3.5 g/dl |
| Amylase | < 70 U/l |
| Total Bilirubin | 3 – 17 μmol/l |
| Calcium | 2.1 – 2.5 mmol/l |
| Chloride | 95 – 105 mmol/l |
| Phosphate | 0.8 – 1.4 mmol/l |
| Haematology | Normal Value |
|---|---|
| Haemoglobin | 11.5 – 16.6 g/dl |
| White Blood Cells | 4.0 – 11.0 x 10⁹/l |
| Platelets | 150 – 450 x 109/l |
| MCV | 80 – 96 fl |
| MCHC | 32 – 36 g/dl |
| Neutrophils | 2.0 – 7.5 x 10⁹/l |
| Lymphocytes | 1.5 – 4.0 x 10⁹/l |
| Monocytes | 0.3 – 1.0 x 10⁹/l |
| Eosinophils | 0.1 – 0.5 x 10⁹/l |
| Basophils | < 0.2 x 10⁹/l |
| Reticulocytes | < 2% |
| Haematocrit | 0.35 – 0.49 |
| Red Cell Distribution Width | 11 – 15% |
| Blood Gases | Normal Value |
|---|---|
| pH | 7.35 – 7.45 |
| pO2 | 11 – 14 kPa |
| pCO2 | 4.5 – 6.0 kPa |
| Base Excess | -2 – +2 mmol/l |
| Bicarbonate | 24 – 30 mmol/l |
| Lactate | < 2 mmol/l |