

Evidence Based Medicine
Study Methodology
Funnel plots are typically used to display:
Answer:
Funnel plots are used to demonstrate the existence of publication bias in meta-analysis. Funnel plots are scatter plots of treatment effects estimated from individual studies on the x axis and some measure of study size on the y axis. Each point on the graph represents one of the studies. A symmetrical inverted funnel shape indicates an absence of publication bias. If there is publication bias, there will be asymmetry of the open wide end due to the absence of small negative results.Types of Bias
Evidence Based Medicine / Study Methodology
Last Updated: 21st April 2019
Bias is the term used to describe an error at any stage of the study that was not due to chance. Bias leads to the systematic difference between the results from a study and the true states of affair. Bias may be introduced at all stages of the research process, from study design, through to analysis and publication. Bias can create a spurious association or mask a real association.
Good research design can reduce the effect of bias (e.g. blinding, randomisation) but they cannot eliminate it completely. Increasing the sample size does not reduce bias.
Selection Bias
Selection bias occurs when patients included in the study are not representative of the population to which the results will be applied. It may be sampling bias, introduced by the researches, or response bias, introduced by the study population. Selection bias can happen not only at the recruitment stage of a study but also when subjects are allocated to different arms.
Sampling bias:
- Berkson (admission rate) bias - arises when the sample population is taken from a hospital setting, but the hospital cases do not reflect the rate or severity of the condition in the population.
- Diagnostic purity bias - arises when comorbidity is excluded in the sample population, such that the sample population does not reflect the true complexity of cases in the population.
- Neyman (incidence/prevalence) bias: arises when the prevalence of a condition does not reflect its incidence. Usually this is due to a time gap between onset of a condition and the actual selection of the study population, such that some individuals with the condition are not available for selection.
- Membership bias: arises when membership of a group is used to identify study individuals.
- The healthy entrant effect - arises where mortality and morbidity rates are lower in the initial stages of a longitudinal study than in the general population because the individuals included in the study are disease-free at its outset.
- Lead-time bias - occurs in studies assessing changes in survival over time where the development of more accurate diagnostic procedures may mean that patients entered later into the study are diagnosed at an earlier stage resulting in an apparent increase in survival from time of diagnosis
Response bias:
- Occurs when individuals volunteer for studies but they differ in some way from the population.
Allocation bias:
- Occurs where there is a systematic difference between the patients allocated to the intervention or to the control group
Performance Bias
- Measurement bias - occurs where a systematic error is introduced by an inaccurate measurement tool
- Misclassification bias - occurs when a categorical exposure and/or outcome variable is incorrectly classified
- Central tendency bias - arises when using a scale where responders tend to move towards the midpoint of the scale (e.g. no opinion)
Observation Bias
- Interviewer bias - arises when the researcher is not blinded, and this alters the researchers approach to the subject and the recording of results
- Reporting/response bias - occurs when participants give answers in the direction they perceive are of interest to the researcher or under-report socially unacceptable factors
- Hawthorne bias - a type of reactivity in which individuals modify or improve an aspect of their behaviour in response to their awareness of being observed
- Recall bias - occurs where there are differences in the accuracy or completeness of recollections by study participants e.g. somebody who develops a disease is more likely to recall a previous exposure to a risk factor than someone who does not have the disease
Attrition Bias
Attrition bias occurs where those who drop-out or are lost to follow-up in a longitudinal study differ in a systematic way from those not lost to follow-up. Thus those left at the end of the study might not be representative of the study sample that was randomised at the start.
Reporting Bias
Bias may also occur after performing a study.
Funding bias is where there is a tendency to report findings in the direction favoured by the funding body and publication bias is where there is a tendency to publish only those papers that report positive, statistically significant or topical results. Excluding studies in a foreign language is another form of reporting bias.
Funnel plots are used to demonstrate the existence of publication bias in meta-analysis. Funnel plots are scatter plots of treatment effects estimated from individual studies on the x axis and some measure of study size on the y axis. Each point on the graph represents one of the studies. A symmetrical inverted funnel shape indicates an absence of publication bias. If there is publication bias, there will be asymmetry of the open wide end due to the absence of small negative results.
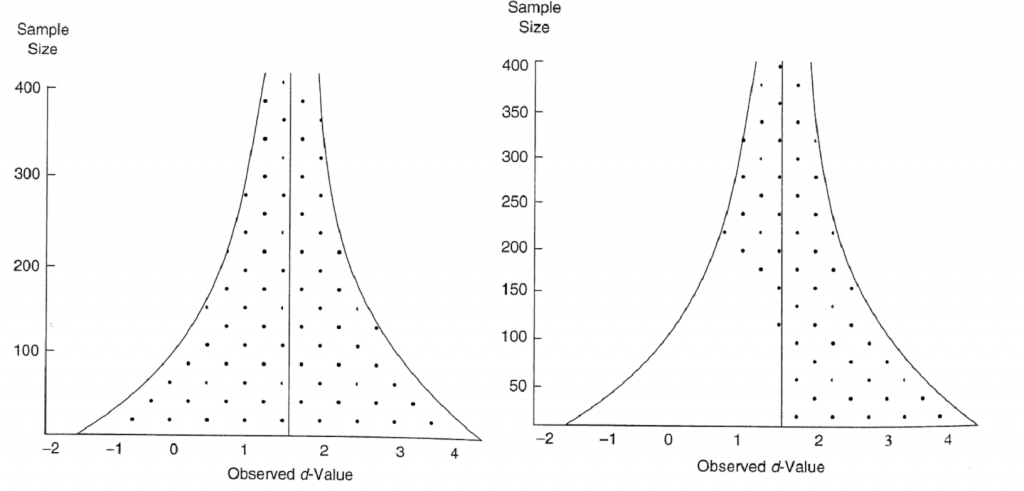
Funnel plot on right side demonstrating publication bias, funnel plot on left side in absence of bias.
Report A Problem
Is there something wrong with this question? Let us know and we’ll fix it as soon as possible.
Loading Form...
- Biochemistry
- Blood Gases
- Haematology
| Biochemistry | Normal Value |
|---|---|
| Sodium | 135 – 145 mmol/l |
| Potassium | 3.0 – 4.5 mmol/l |
| Urea | 2.5 – 7.5 mmol/l |
| Glucose | 3.5 – 5.0 mmol/l |
| Creatinine | 35 – 135 μmol/l |
| Alanine Aminotransferase (ALT) | 5 – 35 U/l |
| Gamma-glutamyl Transferase (GGT) | < 65 U/l |
| Alkaline Phosphatase (ALP) | 30 – 135 U/l |
| Aspartate Aminotransferase (AST) | < 40 U/l |
| Total Protein | 60 – 80 g/l |
| Albumin | 35 – 50 g/l |
| Globulin | 2.4 – 3.5 g/dl |
| Amylase | < 70 U/l |
| Total Bilirubin | 3 – 17 μmol/l |
| Calcium | 2.1 – 2.5 mmol/l |
| Chloride | 95 – 105 mmol/l |
| Phosphate | 0.8 – 1.4 mmol/l |
| Haematology | Normal Value |
|---|---|
| Haemoglobin | 11.5 – 16.6 g/dl |
| White Blood Cells | 4.0 – 11.0 x 10⁹/l |
| Platelets | 150 – 450 x 109/l |
| MCV | 80 – 96 fl |
| MCHC | 32 – 36 g/dl |
| Neutrophils | 2.0 – 7.5 x 10⁹/l |
| Lymphocytes | 1.5 – 4.0 x 10⁹/l |
| Monocytes | 0.3 – 1.0 x 10⁹/l |
| Eosinophils | 0.1 – 0.5 x 10⁹/l |
| Basophils | < 0.2 x 10⁹/l |
| Reticulocytes | < 2% |
| Haematocrit | 0.35 – 0.49 |
| Red Cell Distribution Width | 11 – 15% |
| Blood Gases | Normal Value |
|---|---|
| pH | 7.35 – 7.45 |
| pO2 | 11 – 14 kPa |
| pCO2 | 4.5 – 6.0 kPa |
| Base Excess | -2 – +2 mmol/l |
| Bicarbonate | 24 – 30 mmol/l |
| Lactate | < 2 mmol/l |